Install ELK Stack for akaBot Center
1. Install
1.1 Java
The first step in this process is getting the server prepared for the Elastic services by installing Java and setting up an environmental variable so Elasticsearch can locate Java
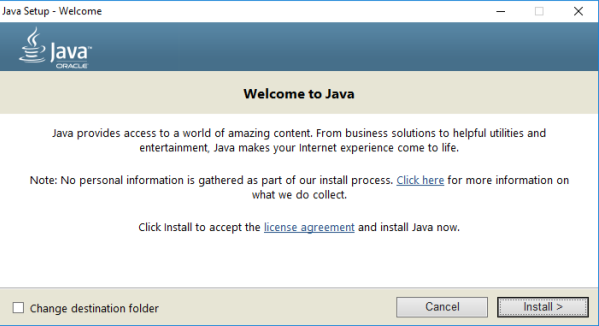
Download and Install Java (https://www.java.com/en/)
Take note of the installation path during the install, you ll need to know that for the next step. It should be something like C:\Program Files\Java\jre1.8_xxx:
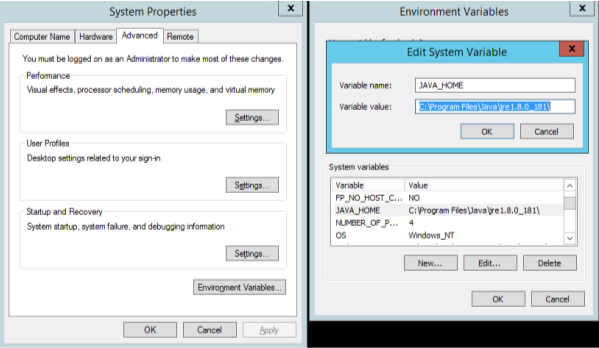
Create a system variable named JAVA_HOME
Open System Properties -> Environment Variables and create a new System variable named as JAVA_HOME with a value of the path from the Java install.
1.2 Elasticsearch
Elasticsearch is the core of the ELK stack and is where all of the data will be stored.
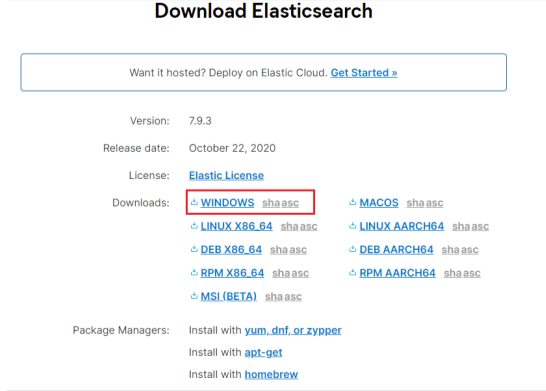
- Download package (https://www.elastic.co/downloads/elasticsearch) - version 7.9.3
-
Extract the downloaded package into a designated folder in your file system (e.g. c:\elk).
-
To install Elasticsearch open a Windows PowerShell prompt (Run as Administrator) and type the following commands:
Invoke-Expression -command c:\ELK\elasticsearch\bin\elasticsearch-service install
- After Elasticsearch installed, open the Elasticsearch service properties with below command, change Startup type to Automatic and start the service.
Invoke-Expression -command c:\ELK\elasticsearch\bin\elasticsearch-service manager
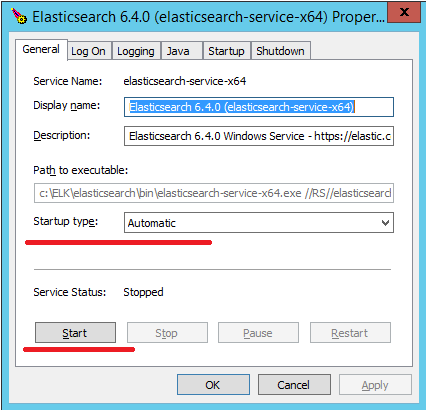
- Running browse to http://localhost:9200
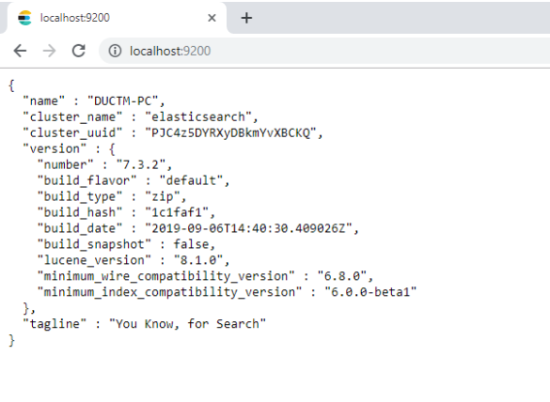
- Open port 9200(default port elasticsearch)
1.3 Logstash
Logstash is responsible for receiving the data from the remote clients and then feeding that data to Elasticsearch.
- Download the Logstash package in .zip format
(https://www.elastic.co/downloads/logstash) - version 7.9.3
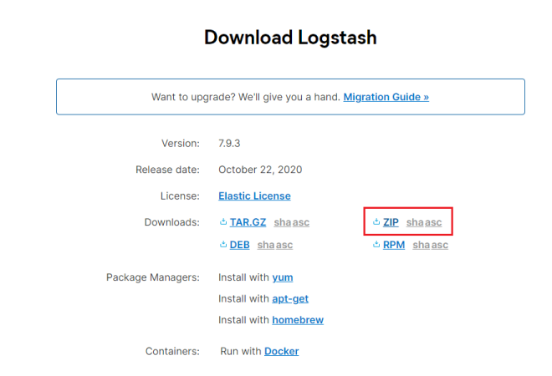
-
Unzipped Logstash folder (e.g. c:\elk).
-
Next is create the configuration file(logstash.conf), which needs saved to the Logstash\config directory
input {

  beats {

    port => 5044

    type => "log"

  }

}

filter {

  json {

    source => "message"

    target => "doc"

  }

}

output {

  elasticsearch {

    hosts => "localhost:9200"

    manage_template => false

    index => "%{[@metadata][beat]}-%{+yyyy.ww}"

    document_type => "%{[@metadata][type]}"

  }

}
There is also a sample configuration file in the config directory named logstash-sample.conf that you can refer to
- NSSM is going to be used to create the service for Logstash. You can download NSSM (Non-Sucking Service Manager) here
(https://nssm.cc/release/nssm-2.24.zip)
- To install Logstash open a Windows PowerShell prompt (Run as Administrator) and type the following commands. We will use NSSM (Non-Sucking Service Manager) to install it as a Windows Service
a. Run following command
Invoke-Expression -command c:\ELK\nssm\win64\nssm install Logstash
b. In Application Tab, set the following settings:
- Path: C:\ELK\logstash\bin\logstash.bat
- Startup directory: C:\ELK\logstash\bin
- Arguments: -f C:\ELK\logstash\config\logstash.conf
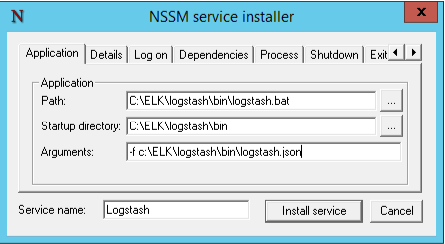
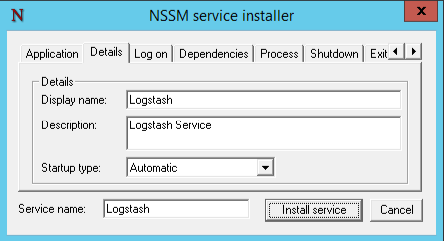
c. In Details Tab, set the following:
- Display Name: Logstash
- Description: Logstash Service
- Startup type: Automatic
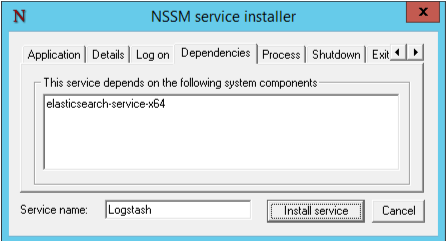
d. In Dependencies Tab, set the following:
- This service depends : elasticsearch-service-x64
- Click Install Service
e. Open port 5044
1.4 Kibana
Kibana is the web based front end that will be used to search the data stored in Elasticsearch. The Kibana installation is very similar to the Logstash install, and NSSM will be used again for the service creation.
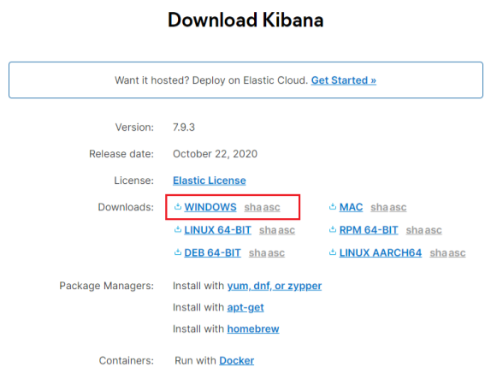
- Download the Kibana package for Windows in .zip format
(https://www.elastic.co/downloads/kibana) version 7.9.3
-
Unzipped Kibana folder (e.g. c:\elk).
-
To install Kibana open a Windows PowerShell prompt (Run as Administrator) and type the following command. We will use again NSSM (Non-Sucking Service Manager) to install it as a Windows Service:
a. Run following command
Invoke-Expression -command c:\ELK\nssm\win64\nssm install Kibana
b. In Application Tab, set the following settings:
- Path: C:\ELK\kibana\bin\kibana.bat
- Startup directory: C:\ELK\kibana\bin

c. In Details Tab, set the following:
- Display Name: Kibana
- Description: KibanaService
- Startup type: Automatic

d. In Dependencies Tab, set the following:
- This service depends : elasticsearch-service-x64, Logstash
- Click Install Service

- Navigate to the Kibana configuration file, found in the config directory, which in this case is C:\ELK\kibana\config\kibana.yml
Open the file in notepad and uncomment/edit the following lines:

Change server.port (recommend port 5601) and open port (5601)
Open services.msc and verify the service starts: Elasticsearch, Logstash, Kibana.
- Verify Kibana is accessible: http://localhost:5601

1.5 Filebeat
Filebeat is used for collecting and shipping log files to logstash.
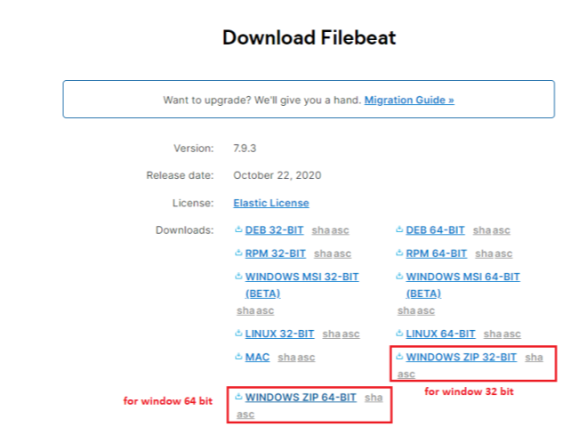
- Download the Filebeat package for Windows in .zip format
(https://www.elastic.co/fr/downloads/beats/filebeat) version 7.9.3
-
Unzipped Filebeat folder (e.g. c:\elk\filebeat).
-
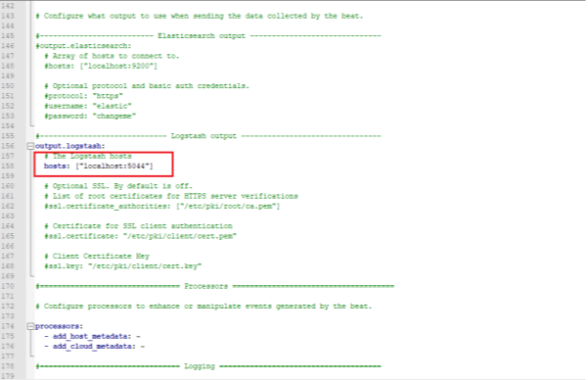
Edit the filebeat.yml configuration file, commenting out the Elasticsearch output and uncommenting the Logstash section setting the host to the IP of the ELK server: (e.g. localhost:5044)
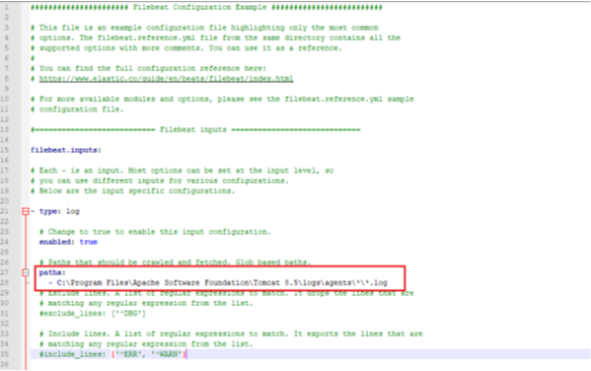
Set Directory contains log file: C:\Program Files\Apache Software Foundation\Tomcat 8.5\logs\agents*\*.log
- Now to install beats, open a Windows PowerShell prompt (Run as Administrator) and type the following commands:
PowerShell.exe -ExecutionPolicy UnRestricted -File C:\ELK\filebeat.\install-service-filebeat.ps1
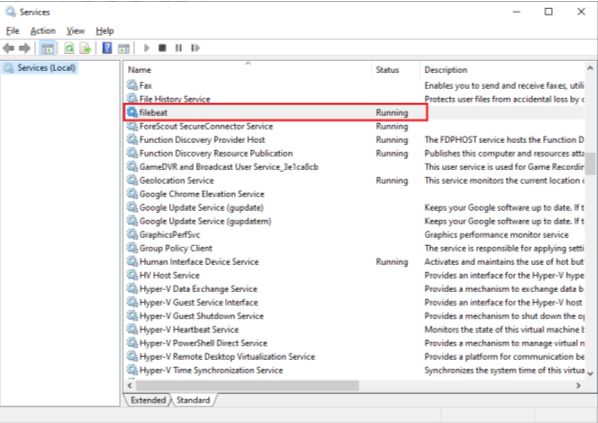
- Open services.msc and verify the service starts: Filebeat
1.6 Creating an index pattern in kibana
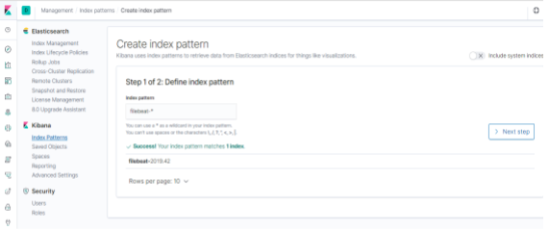
Index patterns tell Kibana what Elasticsearch indices we want to search, so now that there is file logs data in Elasticsearch, an index pattern needs to be configured on the Kibana side.
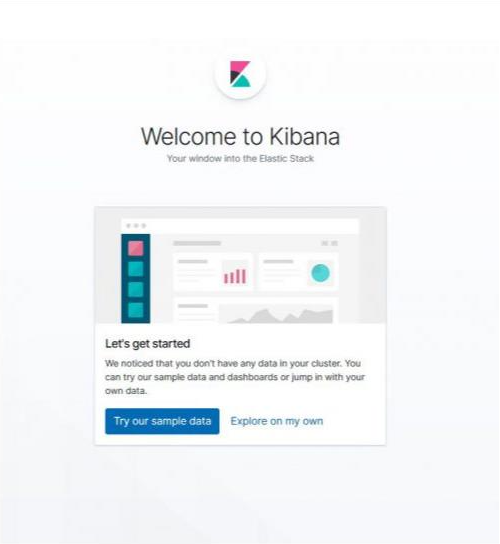
- Access Kibana at http://localhost:5601 and click on Explore on my own.
- Click on Management (Gear Icon) on the left hand menu
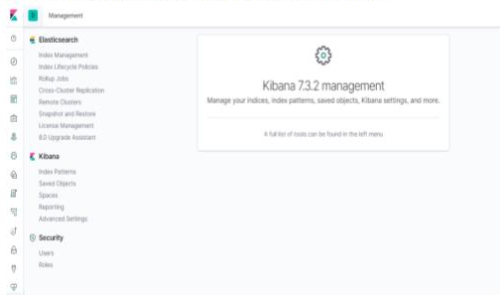
- Click on Kibana > Index Patterns and then Create an Index pattern using filebeat-* as the pattern
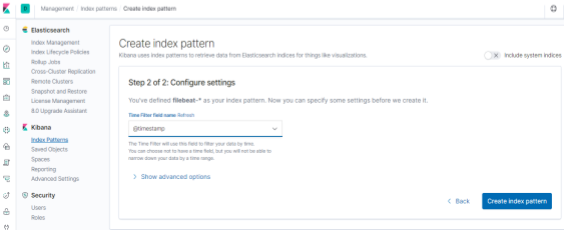
- For the Time Filter field name use @timestamp and then click Create index pattern
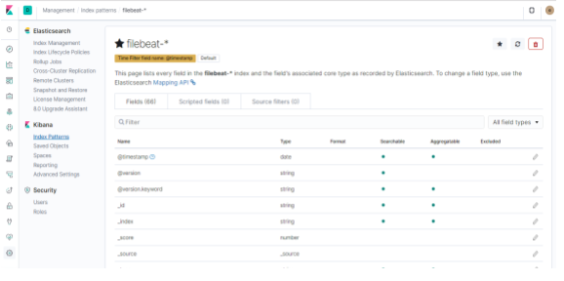
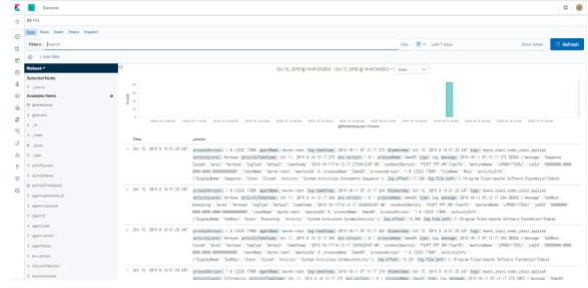
- The File Logs are now flowing into the ELK stack from the ELK server itself.
And under Discover .
2. CONFIG ON CENTER
-
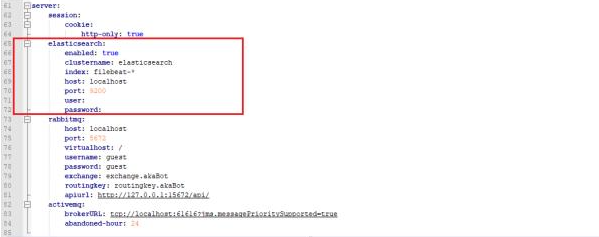
Edit file application.yml => Directory: C:\Program Files\Apache Software Foundation\Tomcat 8.5\webapps\ROOT\WEB-INF\classes\config\application.yml
-
Update elasticsearch properties: enabled=true,..
- Restart tomcat service